Case 001 Memory Analysis
This memory analysis lab will walk you through the entire process, start to finish, for investigating malware in a system’s memory.

Case 001 Memory Analysis [photo courtesy of https://pxhere.com]
Get the materials and follow along!
Have you built your DFIR Fort Kickass, yet? How to build a DFIR Analyst Workstation found here.
Make sure you understand the basic rundown of forensic artifacts.
This post assumes you have a DFIR Analyst Station ready to analyze the Memory Images from the Case of the Stolen Szechuan Sauce.
Learning Objectives of Memory Analysis
- Understand the advantages and goals of Memory Analysis
- Be capable of using common Memory Forensics tools
- Quickly identify network connections
- Quickly find rogue and malicious processes
- Extract plaintext malware samples from memory
Semi-Required Knowledge
- Computer Processes and threads
- Computer memory (the RAM) basic knowledge
- Basic Linux Command Line Fu
- Basic Virtual Machine Operation
Common Tools
- Volatility
- Rekall
- Redline
- Cyber Triage
Tools Covered Here
- Volatility
- netscan
- malfind
- pstree (-v)
- Clam Scan
- FLOSS
- Strings
- GREP
Other Learning Resources on this Topic
- Book: “The Art of Memory Forensics“
- Book: “The Little Handbook of Windows Memory Analysis“
- Videos:
- SANS Poster for Hunting Evil
- SANS Course: FOR526 – Advanced Memory Forensics and Threat Detection
Music
Notes
- Keep solid notes on your thinking around evidence and data that you find
- This is for teammates to understand your thinking
- Understand your own thinking later… or after sleep.
- Notes should be accompanied by screenshots that tell a story
- Examples: Highlights, Boxes, Arrows Text. The reader should quickly understand what they’re looking at
- A great note-keeping App that teams can use to coordinate is OneNote.
- Each host gets a tab etc.
- A great piece of software to take Screen Shots is Greenshot
Walk-through to Get You Started with Memory Analysis
Screenshots
As you go through an investigation you should be taking screenshots of key items and saving those with good notes as to why it seemed important at the time. Additionally, screenshots should ‘Stand Alone’. This means they should have good labels, arrows, and highlights explaining exactly what you have found. This will help teammates, customers, and you understand your findings at the time you took the screenshot. Example screenshots will be provided – but not all screenshots here are examples of what would be in a report. GreenShot is amazing for taking screenshots. OneNote works great for keeping and sharing notes with your team.
Pivot Points
- From PCAP: Malicious filenames, IP Addresses, and Malicious Activity times.
- To PCAP: Malicious IP Addresses, Processes and file names.
- From Disk: Malicious filenames and paths, IP Addresses, and Malicious Activity times.
- To Disk: Malicious file names and paths, DLL’s, IP Addresses, Exfiltration filenames
- From Timeline: Malicious filenames and paths, IP Addresses, processes, DLL’s.
- To Timeline: Malicious filenames and paths, IP Addresses, processes, DLL’s.
Timeline Artifacts in Memory
When it comes time to do the Super Timeline of the disk image we will run a Volatility module called Timeliner against the memory image. Timeliner analysis of the memory image is a huge win here. Certain artifacts that investigators use to determine things like evidence of execution live in memory before being written to disk. One example is the ShimCache. The ShimCache is an artifact produced when Windows tries to determine if an executable needs some compatibility assistance (overly simplified explanation). They also record a timeline of when executables are run! ShimCache entries are not written to the registry until shutdown. However, they are in memory! Investigators can pull these entries from memory and place these entries into the Super Timeline. Link to Supertimline Analysis (Coming soon).
Acquiring Memory
The Memory Image for this walk-through is provided at the link in the beginning of this post. A quick lesson memory acquisition follows.
You want to acquire memory first. It is what is known as ‘Volatile’. This means it is highly prone to changes. Investigators want the best possible view into the state of the machine at the time of the incident; or as close to it as they can. The more activity on the machine between the incident and the time of collection can mean less fidelity of the samples collected.
In this ‘case’ the incident responder had a thumb drive with incident handling tools prepared on it and inserted it into the victim machine. FTK Imager Lite was then run on the machine from the thumb drive. FTK Imager is a free tool from Access Data that makes quick work of forensic collection of the disk images, memory images, and ‘protected files’. Andrea Fortuna has a great walk-through on the collection of artifacts from a machine. As company networks begin to spread out physically, the collection techniques are shifting to remote solutions and lighter ‘triage’ collections. Understanding memory forensics will still be key for digital forensics for many years to come.
- Collect Memory first
- Remote collection is the new hot dance move
- Memory Analysis is key in DFIR
Analysis Station Set-Up
If you haven’t built your nest yet, head over to building a DFIR Fort and get up to speed!
Which Image to Start With
As a personal choice, the Memory for the Domain Controller (DC) is a good place to start. It is the heart of a Windows Enterprise. DC’s are key terrain for both defenders and attackers. Starting efforts at the DC is not a bad idea, especially when it is suspected to be infected. It is suspected here because the victim indicated that data was stolen from it. This alone doesn’t mean it’s infected, it only means it was accessed. However, common attacker techniques tell us they typically want to compromise it in some way. This could be through the installation of malware or simply adding a new account for the attacker to use to login with later.
- Start with key terrain and systems the attacker interacted with.
Transfer the Image to the VM
An easy option is to ensure the VM is network-connected (have you tried ‘sudo dhclient’?). If it’s connected and ready, simply download the Memory Images from the Case 001 Brief. Other options would be to drag and drop the file, or cut and paste the file, from the host to the VM Desktop. You also could simply put it on a USB, and insert the USB into the host and tell the Hypervisor to pass it to the VM. In any case, you will need the image inside the VM.
Place the image in the /cases folder once you have it loaded into the VM. Each case being investigated should get a unique case folder in the /cases directory. Each host should get a directory in that directory. Example layout below.

Making a Case Dir for this Case
From here it is recommended a memory directory also be created to keep all of the outputs we will be creating separate from everything else.
Place the memory image in the memory folder and unzip the files.
$ unzip memory.zip)
- Load forensic artifacts into the cases directory.
- Each host gets a folder
- Each effort on that host gets a folder
Four Memory Analysis Tools
As of this writing, there are four tools that dominate the DFIR World. There is Volatility 2 and 3, Rekall and Redline. A lot of commercial tools exist but are actually nice GUI’s wrapped around Volatility. Volatility and Rekall have the same origins. Rekall is a fork of Volatility 2 and brings speed and many other features with it. Volatility 3 is working to replace Volatility 2, but it hasn’t yet as of this writing. Remember to learn the methodology and not Click-ology. If you get the concept of what is shown here you will be able to apply it to nearly any Memory Analysis tool.
Volatility 2
Image Info
Hopefully, the person who retrieved the image took great notes on the affected system. This is often not the case. This knowledge will be key in analyzing the image. Memory analysis revolves around essentially finding answers in the memory to questions the investigator has. As you work you should start to build a hypothesis based on evidence you find. Do not get married to a hypothesis. Go where the data takes you. Finally, test the hypothesis in a lab if possible.
To find the answers the framework being used needs to know where to find the data structures that have these answers. The map to finding these specific structures in the billions of bytes is known as a profile. There are efforts underway to remove the need for telling the framework which profile to use. For now, we will practice ‘asking’ the image what profile to use. The framework does this by searching the bytes for known signatures of operating systems in the Kernel Debugger Block (KDGB).
In this scenario, you ask around and sure enough, the incident handler took a screenshot of the System Info page and provided in on request.
System Info Page for the DC

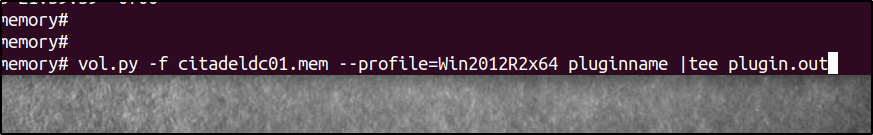
To verify the images weren’t mixed up we will still confirm with the image info plugin of Volatility. A good practice is to pipe many of the Volatility Plugins into a text file. Some plugins take a LONG time to run. Rather than run the same plugin twice you can simply re-read the text output – as long as you saved it to text. When using the tee command the system will no longer output text in color. To preserve color simply install expect in sift with sudo apt install expect. Then lead the commands with unbuffer. Note: none of the modules demonstrated here have important color coding.

- The pattern to Volatility Commands here are: vol.py -f imagename pluginname |tee pluginname.out
- Vol is aging out. This is a warning from Py2 stating it is End of Life
- Vol is scanning the Kernel Debugger Block for Signatures of data structures that match known Operating Systems
- Vol is providing the guesses of the Operating system based on the KDBG Scan to the Analyst. In our case we know it to be Win2012R2x64.
- Times relevant to the case. In this case it incorrect! The image taken LOCAL time is correct but with the wrong UTC time! That is an interesting note. This could be due to something with the VM in the Lab and where it thinks it was… maybe. We will have to keep an eye on this during Super Timeline creation. Another reason a log is very important during an investigation.
From here on for the DC01 we will be using a command line pattern like this:
Running subsequent commands is now as easy as hitting the up arrow and changing the latter part of the command rather than re-typing it. One could also set an alias for the first portions of the command if desired.
- Tee all commands into output files. Any extention works but
.outis a safe bet - Use the up arrow to simply modify previous run commands rather than retype them all.
CTRL+Rwill also allow you to search your history for previous commands
Network Connections
Understanding which processes have, or recently had, connections to remote systems is key. Most modern Malware has network functionality. This can quickly help an investigator narrow their search for which process(es) in memory is (are) malicious.

This will produce A LOT of data on a DC. A good practice here is to do some Linux Fu against the output file after scrolling through it with the less command. What to look for:
- Known bad IP Addresses (If pivoting from other data and findings)
- Known Malicious Processes (If pivoting from other data and findings)
- Processes that don’t normally connect to the internet
Looking through the output we immediately notice that dns.exe is loud! Very loud. We can reduce the noise by removing dns.exe from the data. However, we should make a mental note here that dns.exe could in fact be the malicious process. We will come back to that if we need to. For now, let’s look at connections not related to dns.exe with: grep -v dns.exe netscan.out|less.
That’s better.
What On Earth am I looking at?

- Memory offset of where this connection data structure begins in the connection pool.
- Protocol of the connection.
- Which local interface the connection is coming from. Useful for Servers with multiple Interfaces. Was this in the DMZ? The Management LAN?
- Remote System this connection is connected to.
- State of the connection at the time of collection.
- Process ID
- The Process is allegedly responsible for this connection.
- Timestamp of when this connection started.
Do any processes stand out as odd?

Take some time. Look at the names of processes. Google the names. Especially ones with connections to remote systems.
Try it out before scrolling further.
Memory Analysis spoilers follow.
Did you find a process associated with a name that isn’t well known to Captain Google as being a normal windows process? Was it connected to the internet?
Great job if you found it on your own! If not, do not worry. It takes practice. Note the IP Address, Owner Name, and PID. Take a screenshot. If you haven’t found it yet, let’s walk through it together.
We find a single process connected over IPv4 at the time of the memory collection. Note: this VM really was connected to the actual internet and the Lab net at the same time. It’s a bit of luck this was the only connection.

Notice the language. It is not immediately malicious because it is interesting to us. If this was for a report we may change the language once this information is confirmed and supported with forensics and adequate screenshots.
The Google search showing this is not a common windows process.

While there are some references to past malware this looks fairly unknown to the Windows World. It is “interesting” to us at this time. Next, we turn to VirusTotal to see if anyone else is tracking this IP Address as malicious.

This is interesting. There aren’t any detections yet. This company doesn’t do a lot of business in Thailand, and there aren’t a lot of Content Distribution Nodes out that way either. Checking the Relations tabs might help us out. We see that around the time of the incident there was reference to happydoghappycat-th.com. Lets pivot off of that and look into some Threat Streams.

- It’s currently TLP: White. This means it’s not known as an indicator of compromise.
- This is interesting. It’s a baby domain. That is often a sign of trouble. How would any user on this network know anything about this website… especially in Thailand. These facts will shift over time. In other words, if anyone is looking at this exercise after November 2020 this site will no longer be a ‘Baby Domain’. The IP Address will likely no longer match, and the site might be completely gone. For this exercise use the information above.
- The first time of domain observation. A decent indicator of the ‘born on date’.
Note: No detections or warnings about an indicator does not mean its benign (good). It just means it is not yet known to be bad.
This IP and Domain was briefly an IOC for an APT. Between the time of this writeup and when the research was done for the lab, it was no longer considered an IOC. It worked out well since there are many cases where there is lag time between detection and knowledge of an IOC reaching the Community.
Malfind
Malfind is a Volatility program that frankly does some magic for the investigator. It examines many aspects of every process in memory and does a great job of determining which ones smell of evil. As stated from the Malfind GitHub page:
The malfind command helps find hidden or injected code/DLLs in user mode memory, based on characteristics such as VAD tag and page permissions.
Malfind is great at its job. It will get Analysts close to the mark. To do this, simply run the plugin and tee the output as normal.

- Is the Process name
- Is the Process ID
- Process Address Space being examined/flagged
- VADs Protection Flags. PAGE_EXECUTE_READWRITE = There is no file on disk for this executable code in memory.
- Hex Dump of the Memory Space
- Assembly Dump of the Memory Space
Now what?
Rob Lee of SANS taught this amazing technique to our FOR508 class. To identify actual functioning injected code look for peanut butter and jelly sandwiches. You read that right. Start looking for code sandwiches. If its a bunch of instances of ADD [EAX], AL its likely not functioning code. If it is something like:
ADD [EAX], AL
something else
ADD [EAX], AL
and so on…
(Again – its more about finding a pattern like A-B-A. Add EAX here is merely an example).
If you see a pattern like this you are likely looking at actual injected code – a sign of malware (not always). If you are lucky enough to find an MZ, and, or, something about DOS MODE in the Hex you likely struck paydirt.
Go ahead and take a look on your own.
Memory Analysis spoilers ahead.
The following are some examples to follow along with on how to find the malicious process.
Take PID 1292. Do we see Sandwiches?

Nope. This doesn’t look like a great sandwich pattern. Let’s keep moving.

Definitely not a sandwich in 1236…. keep scrolling.

Well, well, well what have we got here. This looks like some sandwiches… and with XOR! XOR is a common obfuscation technique of Malware authors. Screenshot that. Take note of the Process name and PID. Keep looking. This is is exciting.

3724 you’re not smelling so hot. You smell like malware. Notice we have the magic Hex numbers for MZ, otherwise known to muggles as a portable executable. This is likely injected code.
Injected Processes
What is this Injected Process non-sense?

Malicious processes are able to inject themselves into legitimate processes to hide from the Operating System, and folks like you hunting evil. However, there are a few telltale signs that give it away. Much like the picture above, despite detectable signs being visible, it is still an effective disguise.
How are the screenshots and notes coming? You are taking those, right?
- Malfind narrows the search for malicious processes
- The assembly code you are looking at is suspected to be code injected into a process
- One way to tell if its executable code is to find the A-B-Aish pattern, or sandwich, in the assembly
- MZ in the Hex dump of the injected code is also a sign
Malfind Dump
Another trick in our arsenal is to have malfind carve and dump processes into a directory. We can then examine those files and run Clam Scan AV against them as a ‘second’ option. This is also a good dance move if you are having trouble locating the malicious process.
![]()
Update ClamAV with freshclam.

Then run clamscan.
clamscan -o *

PAYDIRT. We are onto ’em!
- Command to run clamscan and only print infected files
clamscan -o * - The name of the infected file, in this case, it’s conveniently named by volatility by the Memory Address that indexes the memory location of the dumped file. In other words, the address to find the code is in the name of the file.
- What ClamScan classifies the malware as, and in this case its the prolific Meterpreter. Meterpreter is bad news if you’re the defender. It is highly capable malware that pairs with the Metasploit Framework.
- In case you missed it was 2 results of infected files.
Screenshot this and make notes.
What does Meterpreter tell us about the attacker, their toolset, and capabilities?
Note the memory address and go back and look at the output from malfind to locate which process is infected. When you go back and look you will see it process 3724 – the Spoolsv.exe.
With Google or enough experience, we can find that Meterpreter has the ability to migrate processes. It does this by injecting itself into a legitimate process.
Keep Digging with Simple Analysis
Let’s see what this unencrypted version (because it’s being extracted from memory) of the payload can reveal with some simple analysis.
Copy the malicious files to their own directory.
mkdir meterpreter
cp proc.address.dmp meterpreter/.
Make sure you use a valid dmp file name that matches the work you did above on determining which process had the infectious code. Remember your Linux tab key fu for auto-completing filenames.

In that new directory with the two malicious files, we will run FireEye’s FLOSS ( FireEye Labs Obfuscated String Solver) against them. FLOSS is an amazing tool in the DFIR toolkit. If strings became a black belt in pulling intelligible strings of characters from malware and other odd data sets it would be FLOSS. From the FLOSS site:
The FireEye Labs Obfuscated String Solver (FLOSS) is an open source tool that automatically detects, extracts, and decodes obfuscated strings in Windows Portable Executable (PE) files. Malware analysts, forensic investigators, and incident responders can use FLOSS to quickly extract sensitive strings to identify indicators of compromise (IOCs).
Malware authors encode strings in their programs to hide malicious capabilities and impede reverse engineering. Even simple encoding schemes defeat the ‘Strings’ tool and complicate static and dynamic analysis. FLOSS uses advanced static analysis techniques, such as emulation, to deobfuscate encoded strings.
Incident responders and forensic analysts that understand how to interpret the strings found in a binary will understand FLOSS’s output. FLOSS extracts higher value strings, as strings that are obfuscated typically contain the most sensitive configuration resources – including malicious domains, IP addresses, suspicious file paths, and other IOCs.
Hear me now. FLOSS. all. the. things.
Floss likely only needs to be run against one of the dmp files since both of them came from the same injected process.
floss filename.dmp |tee output.out

What you may have already caught at the very end was a TCP Callback address!

Paydirt, again! We now know the 3724 Spoolsv.exe process is injected with malicious code and is calling back to the same address as the strange process associated with coreupdater.exe! This tracks back to coreupdater.exe as being guilty by association. This is the enemy Command and Control (C2) channel! The C2 channel, or callback, is how the adversary maintains contact with the malware deployed to our victim network.
- Malfind was used to flag and dump memory sections from the processes that it flagged. We dumped these into a directory.
- From the directory, we used Clam Scan against those objects to find malicious code.
- We made a note of which process was the guilty one by matching the address found in the name with the PID/Address output of malfind
- Then we ran FLOSS against the known infected data objects to find IOC’s like domain names or IP addresses. We found an IP Address.
Process Trees and Lists
Let’s take a look at where our two suspect processes lie in the bigger picture using the pstree module.

Walk-through of the evidence:
- We have confirmed Spoolsv.exe 3724 is up to no good, in which the malicious injected code is set to communicate with an IP Address of 203.78.103.109 – same as coreupdater.exe. After a quick Google search or experience, we find that Spoolsv.exe is normally a legitimate Windows Printer Spooling service that runs from C:\Windows\System32.
- We see that Spoolsv.exe 3742 has the parent of 452 (we will glance in a second)
- It is active with 13 threads (anything more than 0 means active)
- and was launched or modified at 0329 UTC (possibly wrong hour shift remember?)
- The Parent PID is Services 452. That part at least seems normal.
- The other interesting, but now suspect process, 3644 coreupdater.exe had an active network connection to 203.78.103.109.
- It has a parent of 2244 – which is gone? Hmmm. That is interesting and suspect.
- It has been dead for a bit with 0 threads…
- It was started at 0356… which is likely 0256 UTC when we correct for the wrong time shift Volatility pulled.
Alright. What do we have so far?
Coreupdater.exe that isn’t well known was started at 0256 UTC and has no parent process present in memory. It was at some point communicating with 203.78.103.109 which we are able to tie to malware found on the system. We also have a confirmed malicious process of Spoolsv.exe 3724 that is active and started at 0329… err 0229 UTC. We also know Meterpreter can migrate from one process to another.
File Paths and Pivots
Let’s collect some file paths of the suspect processes. This information is invaluable to Host and Hunt teams still in the fight. They can take this information and begin finding other hosts with these same files/paths. This can be used to further scope the incident. It will also make great pivot points to work off of when we go to analyze the disk.
Running the module pstree -v will reveal the full path to the image that loaded the process into memory.


We now have a path where this odd file was written to disk; we can use this later when we examine the disk. It may no longer be there if the attacker deleted it. This is definitely an IOC to start using to find other infected hosts. It’s also located in System32 which means the attacker likely had Administrator and System-level access to the System. With Spoolsv.exe being legitimate this is likely a benign copy on disk, and the copy loaded into memory was corrupted.
Memory Analysis Hypothesis Time
At this point, we have some IOCs on the kill-board. We know:
- A suspect process that is not well known to exist on Windows servers, coreupdater.exe, was communicating with 203.78.103.109 – A server that lived in Thailand around the suspected incident.
- We have confirmed that a legitimate process, 3724 Spoolsv.exe, has had Meterpreter injected into it which is now also primed to communicate back to 203.78.103.109, which is the same IP Address that the strange file coreupdater.exe was communicating with.
- Meterpreter has the ability to migrate from one process to the other.
- One of these two is inactive and the other is active by looking at the thread count.
Knowing that times recorded in Memory are not absolutes the following hypothesis emerges: Somehow this coreupdater.exe landed on the system and was communicating to a remote system and is tied to malware on the system. At some point, it injected its malicious code into Spoolsv.exe where it is living now- or was at collection time. This also tells us something else. The original malware had to be at the SYSTEM level. Which on a DC means the attacker likely has the Domains entire list of credentials. This just got ugly.
With some fresh IOC’s, or confirmation of previously found IOC’s, we are ready to move to our next artifact.
Desktop Image Analysis
That was the walk-through on the DC. Interestingly, when the analysis was started on the Windows 10 memory it didn’t work. I have some theories- there have been a lot of issues with Windows 10 images. I suspect it might be that the latest build of Windows 10 Enterprise does not have a supported profile yet. The other possibility is it was somehow corrupted at collection time. Just like in a real-world case we must play the ball where it lies!
Let’s take a peek at the System Information for the endpoint from which this memory was collected.

After a bit of searching, it appears that System Build may not be supported yet in Volatility. I will look into this later.
Creative Solutions For the Win
We know our IOC’s at this point. Bottom line we want to keep scoping the incident out. We know the adversary infiltrated and infected the Domain Controller. Now we must see if they got their evil little fingers into the desktop. The problem is something is either wrong with the memory image, or it’s simply not supported yet. I had an idea. What if only part of this is corrupted? I should be able to check with strings.
strings DESKTOP-SDN1RPT.mem |head -20

Well. Look at this. There are intelligible strings in this… if there are strings here I can probably look for IOC’s! It was time for bed though, and I really wanted to take a look at this in rekall for this post (and vol3).
In the morning I reached out to Tyler Hudak (@SecShoggoth) to check if he was able to get this image to load properly. He is one of the best in the industry (you should check out his videos and classes as well!). He confirmed he was unable to get Rekall or Volatility to properly load the image and also mentioned he had run strings against it and suggested strings analysis.
Whoa! Tyler Hudak had suggested the very thing I was thinking up as an approach. I took it a step further and ran FLOSS and dumped the output to an output file.
floss DESKTOP-SDN1RPT.mem | tee floss.out

If you prefer not to have the screen flicker for a few moments simply redirect the output with:
floss DESKTOP-SDN1RPT.mem >floss.out
It’s totally your preference.
Many attackers use the exact same attack sequence when they make entry into a new system. This repetitive nature is something we can, and should, exploit. Knowing they use the same maneuver every time we will search for previously discovered IOC’s. This is why we refer to them as Indicators of Compromise and track them carefully. The FLOSS output file has over 18.1 million lines of strings in it. To make the search easy let’s use GREP.
grep coreupdater floss.out

Gotcha. We say likely here because we aren’t absolutely sure when doing strings analysis. We are very certain that that malware existed in memory in some way here. Additionally, we believe it is likely it was installed – but it could have been in a notepad document when the memory was acquired for all we know. Remember – report and brief the level of confidence in findings. Don’t state things as fact without being able to prove them with evidence. FLOSS is merely showing that that specific string existed in memory. As experienced forensicators we can say it was likely infected (still a bit thin to be honest).
Now let’s check if there was a chance it was communicating with the same IP Address of 203.78.103.109.
grep '203.78.103.109' floss.out

An example report excerpt to go with the example report screenshot:
The known adversary Command and Control (C2) IPv4 Address of 203.78.103[.]109 that was discovered in malware found on the Domain Controller, Citadel-DC01, was found in the memory acquired from DESKTOP-SDN1RPT. This finding is supporting evidence that this system was likely compromised by the adversary. It is likely the adversary installed the same malware found on the DC on this system. It is probable that this system was also communicating with this address.
Note the language. We don’t commit to anything that we can’t prove. However, this could be confirmed by looking at the PCAP from the network perimeter!
- Create output files
- Search output files quickly with Linux tools for previously discovered indicators
Data Pivots
This is a great example of how to properly pivot through the evidence! If you notice we didn’t start blindly and randomly poking around in the Desktop memory. When we ran FLOSS we ended up with 18 MILLION lines of data. We were able to properly pivot using tools and previously discovered IOC’s. This same concept can be applied across entire networks. Imagine this same victim network with 10,000 endpoints (aka hosts). We could query the Firewall logs to see if this malicious IPv4 address was found communicating with any other hosts. From the results, we can get an idea of how many, and which, hosts were likely infected. This concept can be applied nearly everything in DFIR and is why keeping well-organized notes and supporting evidence is very important.
- Pivots are how DFIR teams can’t do investigation at scale
- Pivots are how an investigator can speed up the investigative process
Conclusion and Recap for Memory Analysis
Memory analysis offers an unencrypted view of processes running in memory. This means the sections of memory that can be carved and dumped are also in plain text (unencrypted). Antivirus programs like Clam Scan have a much easier task of finding evil when used against plain text objects. “Malware can hide but it has to run”.
We started by looking at network connections found in Memory. This allowed us to spot a process that was suspicious. This would have been a quick win for us, but it looks like the adversary might have migrated to the spoolsv.exe. Spoolsv.exe was definitely infected and active when the memory collection occurred. From this image, we identified an instance of meterpreter and the full file path to where it was installed. We analyzed the injected meterpreter code found in the spoolsv.exe to identify, or confirm our suspicion about, a malicious IPv4 address. This finding further tied spoolsv.exe and coreupdater.exe together and support our migration theory.
We then took this information to pivot into the second image. Rekall and Volatility were unable to analyze the image recovered from the desktop machine. This inconvenience is not a show stopper. We analyzed the image with FLOSS and put the results into a text file. We then searched for known IOC’s in the 18.1 million lines of data in this file using common Linux tools. The findings from the results of these searches indicate desktop infection. This evidence alone merely points to it being a likely scenario, but it’s unconfirmed. It will take analyzing more evidence to continue building out the story of what happened to the victim’s network. At least now we have some solid IOC’s to work with during further analysis of the artifacts.
IOC’s to Take Away
We don’t know if we will find the IOC’s in artifacts listed below, but they are great pivot points to start with things like keyword searches etc.
To Disk: Filepath C:\Windows\System32\coreupdater.exe, PID 3644, and a malicious IP of 203.78.103.109.
To PCAP: Malicious filename: coreupdater.exe and a malicious IP Address of 203.78.103.109.
and To Autoruns: coreupdater.exe
Things to Study or Try Next
- Try the same analysis of the DC memory with Vol3. Simply try
vol3 -hto see the options. Keep in mind Volatility 3 does not require a profile. - Use Rekall to analyze the DC Memory.
- Explore the
handlesmodule for Volatility and Rekall. Handles will give you an idea of what Malware may have been trying to access! - Use the
hollowfindmodule for Volatility.
This was merely an intro to the deep well of knowledge that is Memory Forensics. If you enjoyed it, use materials at the beginning of this post to keep studying!
Choose Your Next Move
I want to look at the PCAP {recommendation 1)
I want to look at the AutoRuns (recommendation 2)
I want to mount some victim drives and start exploring those
Registry Hives Seem Interesting. Lets go there.
Nah, I would like to do a quick look at the disk image timeline
I will create a super timeline and analyze it
Thank you so much James
Great stuff!
Excellent piece of work. Thank you!
Thank you for the effort put into creating this tutorial series.
One question, why is the adversary IPv4 address sometimes written with square brackets, e.g 203.78.103[.]109? Is it a typo (it occurs several times, but not all?
Great question!
Hopefully it has the brackets where ever its copy/pastable. The brackets are a method of making the IP address harder to cut and paste, or “clickable”. This is known as “de-fanging”. It’s a bad moment when a defender accidentally clicks or pastes a known malicious IOC.